Windows Inter Process Communication A Deep Dive Beyond the Surface - Part 8

Welcome to the new part of IPC, this part supposed to be the final part of the first wave that I started almost three months ago. However I extended this wave to one more part where I will talk about reverse engneering the RPC server.
This part completes the last post where we talked about RPC research tooling. In that post, we mentioned the external toolset you can use while doing your research. Today, we will continue this journey and talk about internal research tools.
As I mentioned earlier, the environment you use (external or internal) changes the final goal of the research. The most interesting target of internal RPC research is local privilege escalation. While the external tools mainly depend on Impacket, the internal tools are based on different programming languages, and each tool serves a different purpose.
In this blog post, I will not go deep into how these tools work internally, because it is complicated. I will explain that later in the second wave, where we will talk about dynamic analysis of the RPC model.
Instead, our workflow today will be simple. We will use a basic RPC server that runs as an executable, and we will test all the tools on this server to see what information we can get from each one and in which scenario each tool is useful.
We will start with a tool called RPCView, a GUI tool that lets you see exposed RPC servers in all system processes. After that, we will look at the NtObjectManager module and how we can use it for RPC research. Next, we will check RPCMon, a tool that parses RPC logs across the whole system.
So let's jump in...
Testbed:
Our testbed is simple. We will use one of our RPC servers that we used before in another blog post. You can find it here. The server is basic: it exposes one interface, and that interface exposes one function.
The function receives a string from the client and returns an integer, which in our case is three.
The function definition in the IDL file looks like this:
interface ExampleInter
{
    int PrintString([in, string] const char* str);
}
The interface UUID is:
12345678-1234-1234-1234-123456789abc
And the server exposes one endpoint through an ALPC port. The name of the ALPC port is example_endpoint.
That is all the information we need to know about the server. So let’s compile it and start testing every tool we mentioned earlier.
RPCView:
RPCView is a free and open-source tool that lets you see all RPC interfaces exposed by system processes. It also shows useful details about each interface, such as its endpoints, available functions, and basic properties. One of its most helpful features is the decompilation tab, where you can view the exposed functions, their parameters, and the data types they use.
The internal logic of the tool is outside the scope of this post, but there is a good blog that explains how it works. In short, the tool scans every process on the system and reads RPC structs inside the RPC runtime library to collect information about RPC servers.
Now let’s test it with our server. After running the server, we open the tool.
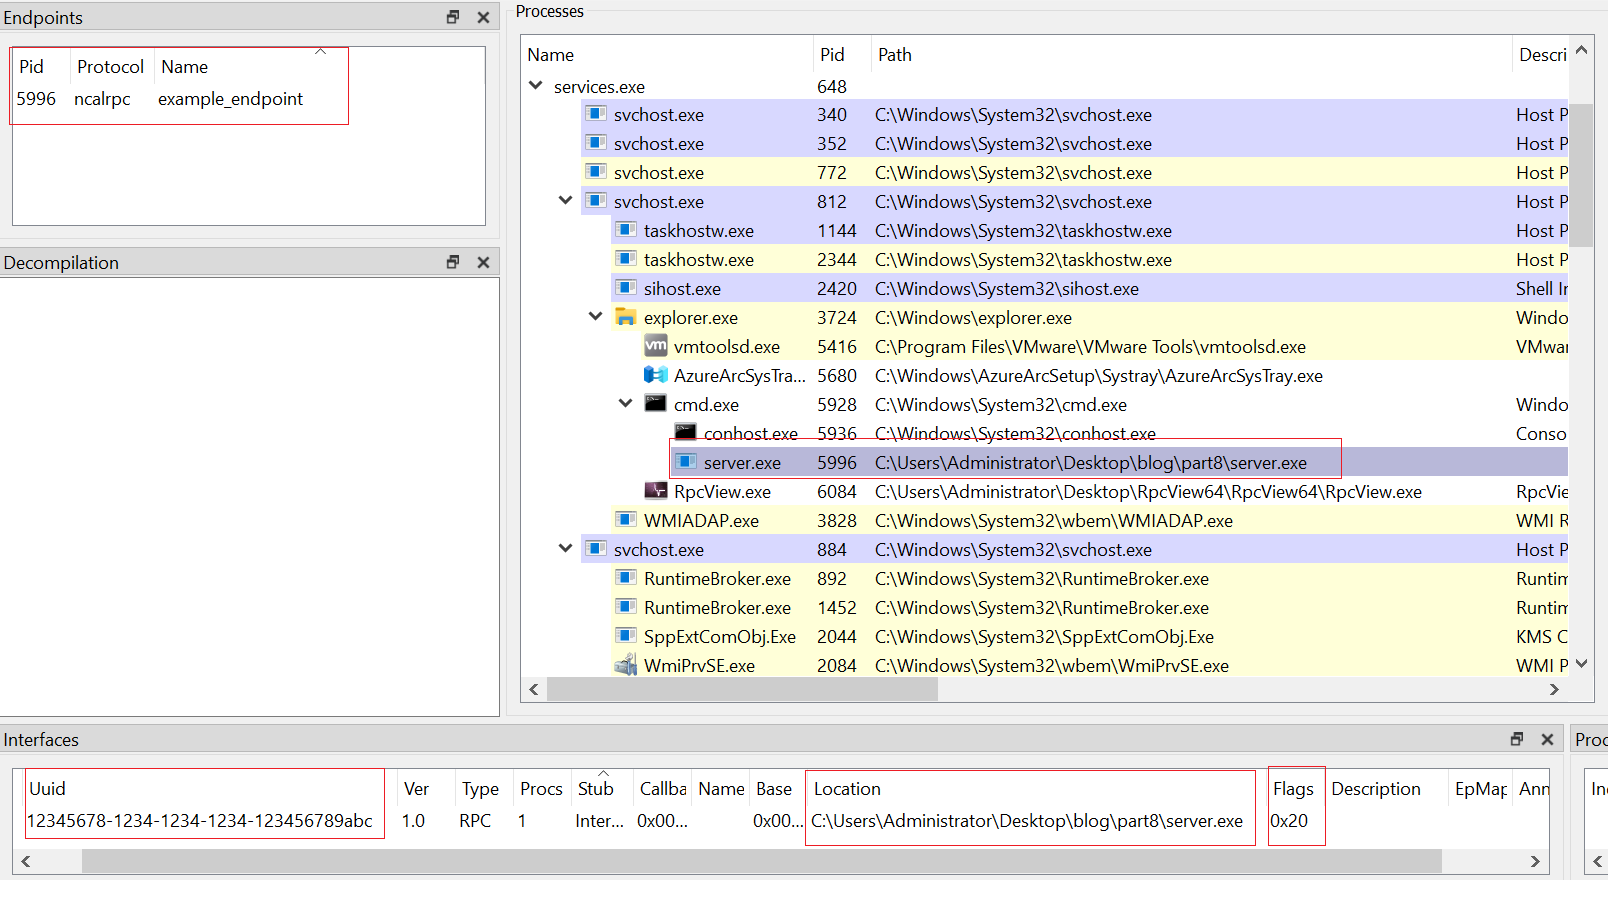
As you can see, RPCView correctly identifies the interface UUID, the number of procedures, and where the interface is located. It also shows the registration flags, which are 0x20. This matches our code, where we use C_IF_ALLOW_LOCAL_ONLY. RPCView also detects the endpoint type and the endpoint name.
Another useful feature is the decompilation tab, which almost rebuilds the original IDL file. To open it, right-click the interface UUID and choose Decompile.
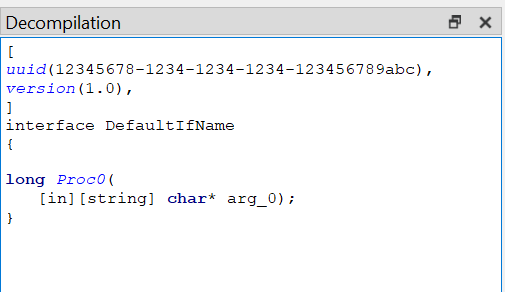
The result is very close to the actual IDL file.
From this, we can clearly see that the function receives a string and returns an integer.
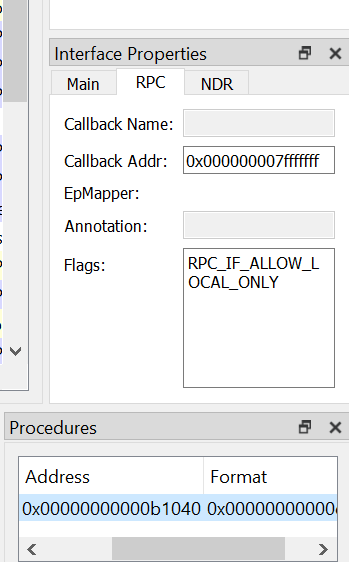
RPCView also provides other helpful windows. For example, Interface Properties shows things like the callback address (if it exists) and converts flag values from hex to readable strings. The Procedures window gives more details about each function, including its memory address.
It’s impressive how much information this tool can extract. However, as I mentioned earlier, we will learn how to do this manually in the second wave of the series.
RPCView is very useful when you want quick information about an RPC server without deep reverse engineering. It gives you everything you need to build a client: how to reach the server, the interface UUID, the registration flags, and how to call the functions correctly.
In our example, the function uses simple types, but I have also tested RPCView with more complex data structures, and it worked well in most cases.
The only downside is that RPCView is best for manual inspection. It becomes harder to use when dealing with a large number of RPC servers.
NtObjectManager:
I have mentioned NtObjectManager many times in my blogs and research. It is one of the most useful tools for Windows research. It supports many internal Windows features, it works as a PowerShell module (so you don’t need to compile anything), and most importantly, it is open source.
NtObjectManager also supports RPC. This means you can use it to parse RPC servers, extract interfaces, and even generate or create RPC clients. The RPC features in the module work by parsing specific data structures after loading the binary into memory.
There is a blog that explains how this works internally, and we will also cover this later in the next parts of this series.
Many blog posts show how to use this module in RPC research, and I highly recommend checking this one to see all the available options.
Now let’s test the module with our server. Installing and running the module is out of scope for this blog post, but it is very straightforward, and you can follow the link I shared earlier.
Our analysis will be static, meaning we do not need to run the RPC server so far.
One important thing to remember:
If you compile the server as 32-bit, you need to use 32-bit PowerShell. If the server is 64-bit, use 64-bit PowerShell.
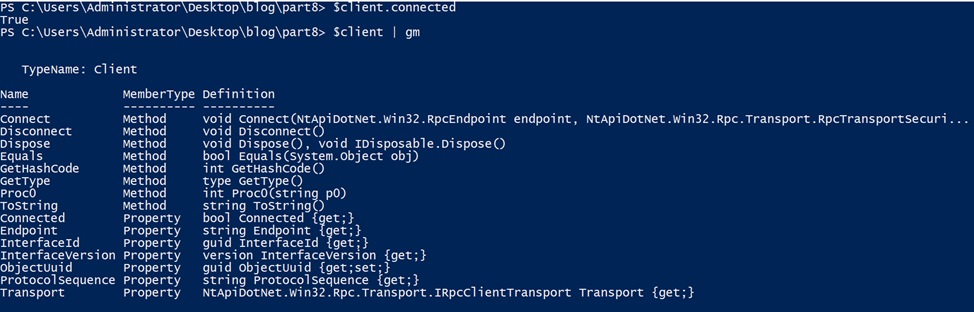
The first command we will use is Get-RpcServer, which extracts the interfaces from a DLL or EXE.
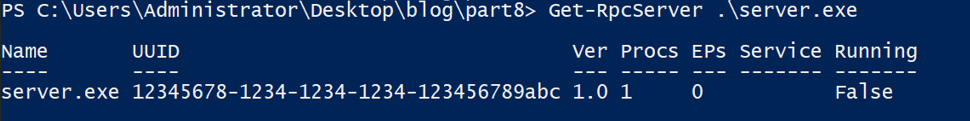
As you can see from the output, it successfully identifies the exposed UUID and the number of procedures. We can show more properties of the server object by using fl *.
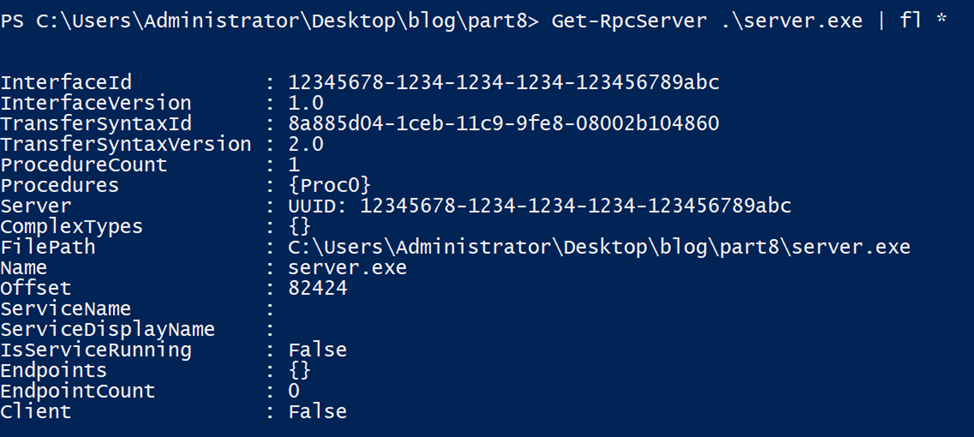
As shown in the photo, the module failed to extract the endpoint, and it also reports that the EXE has no RPC clients.
We can also extract information about the procedures. In our case, we have only one.
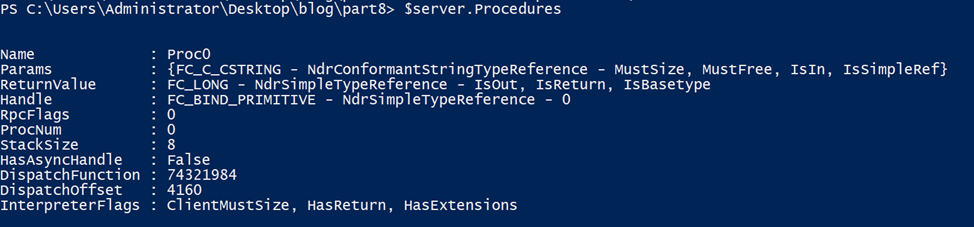
From the output, we can see that the procedure has one input parameter of type string, and it returns a long value.
Before we talk about creating the client, we have to solve one problem:
NtObjectManager failed to detect the endpoint.
There are several ways to get the endpoint using NtObjectManager. One of them is to query the endpoint mapper service locally using WinAPIs. The command Get-RpcEndpoint interacts with the endpoint mapper database to search for endpoints for a specific interface.
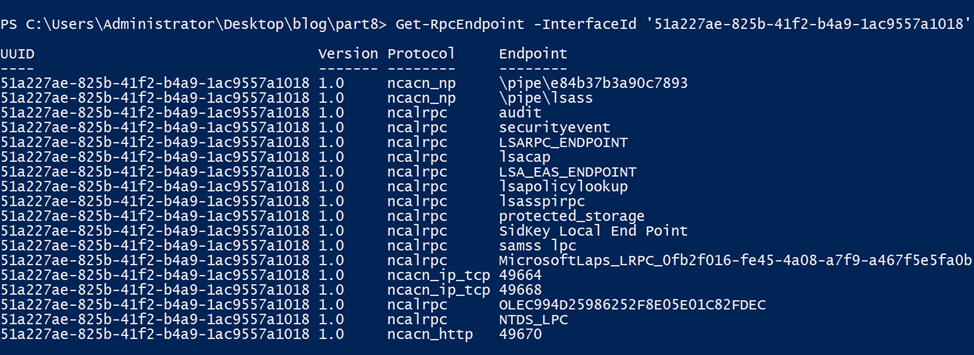
However, as we know, not all RPC servers register their endpoints in the endpoint mapper database. Also, the server must be running for this method to work, which is not the case in our static analysis.
Now let’s see how we can create the client using the information extracted from server.exe.
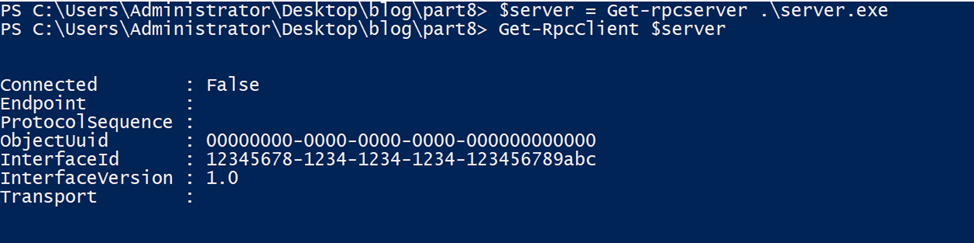
The client has been created, but we must supply the endpoint and connect it to the server.
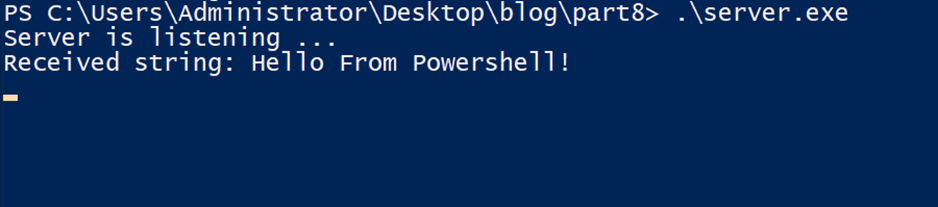
Don’t forget to start the server at this point.
To connect the client, use the Connect-RpcClient command:
Connect-RpcClient $client -StringBinding "ncalrpc:[example_endpoint]"
Here we added the endpoint manually.
After connecting, we can check the client status by looking at the Connected property. Then we can list the supported procedures.
As you can see, Proc0 is the function exposed by the server interface, and we can now call it from PowerShell.
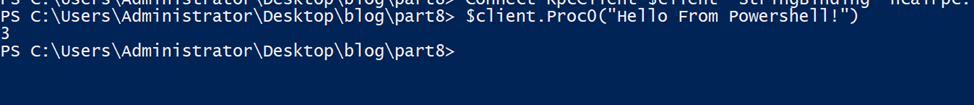
The function call was successful, and the server returned 3, as expected.
If we check the server output, we can see the string we sent as the function argument.
As you can see, it is very easy to parse the server and connect to the client, all during runtime. You don’t need to write or compile any code, which is extremely helpful during RPC research or when building a fuzzer.
The main problem is endpoint extraction. If you are working with one or two servers, finding the endpoint manually is easy. But when you need automation, missing endpoints becomes a real challenge.
RPCMon:
The developers describe RPCMon on GitHub as:
RPCMon can help researchers get a high-level view of RPC communication between processes. It was built like Procmon for easy usage and uses James Forshaw’s .NET RPC library. RPCMon can show you the RPC functions being called, the process that called them, and other relevant information. RPCMon uses a hardcoded RPC dictionary for fast processing, which contains information about many RPC modules. It also has an option to build your own RPC database so the tool can update missing details from your system.
I think this description already gives a clear idea of what the tool does. In short, it shows the communication between two processes over RPC, including which functions were called. It also has a built-in database to map interface and function numbers to readable names, which makes debugging much easier.
This tool depends on ETW (Event Tracing for Windows), where RPC communication logs are stored.
A very useful feature is the ability to filter for a specific process, whether it acts as the client or the server.
Let’s see the tool in action.
The user interface is very simple. The most important buttons are Start, Stop, and the Filter button. You can filter by PID, process name, or several other criteria.
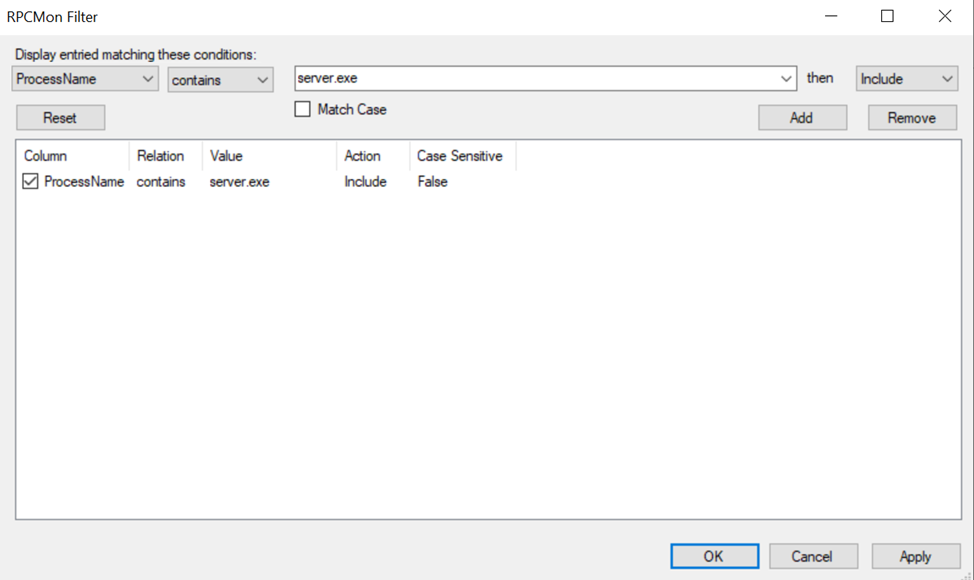
In our case, we will filter for the process name server.exe.
After applying the filter, we start the capture and then run both the server and the client.
Sometimes you may notice that no events appear in the output (as happened to our client and server). This happens often with this tool, probably because of the large number of ETW events on the system. However, it has still been very useful for me in many cases especially when I do not control the server or client, and I want to monitor RPC calls without manually opening ETW logs.
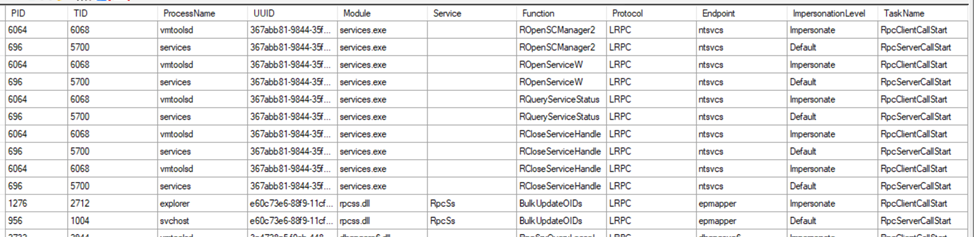
Here is an example from the output. You can see events from different processes and view details such as the endpoint, protocol, called function, impersonation level, thread ID, and the interface being used. The tool also supports exporting the captured data.
As you can see, it also translates function names based on its internal database, which is very helpful.
As you can see, when it comes to external tools, there are not many options available, and none of them are perfect. But when you combine all of them, your research goals become much more reachable.
In the end, in this blog post, I wanted to talk about an RPC fuzzer that was developed here. However, I realized that it introduces many new concepts that we haven’t covered yet. So I decided to leave it for later, after we explain a few more important ideas.
See you soon in the next part!