ICS security series: ICS and SCADA Security HTB track, part 1

Given my current role in the ICS (Industrial Control Systems) security department, I frequently engage with various aspects of industrial infrastructure, with a particular focus on network protocols and the analysis of network traffic.
Starting off this new blog series, my plan is to showcase different ICS protocols. To make things more engaging, I'll be throwing in a mix of challenges and scenarios related to ICS security. The aim here is to give you a deep dive into each protocol, exploring all the details and quirks.
The Hack The Box platform recently rolled out a new track called "ICS and SCADA Security." This track includes two web challenges and seven hardware challenges, all specifically centered around Industrial Control Systems (ICS).
Our primary objective should not be focused on obtaining the flag, but rather on gaining a deeper understanding of Industrial Control Systems (ICS).
Watch Tower:
In this blog I will write about the hardware challenges only, and I will scape web challenges. The first hardware challenge is called “Watch Tower”, the challenge description is:
Our infrastructure monitoring system detected some abnormal behavior and initiated a network capture. We need to identify information the intruders collected and altered in the network.
The HTB platform has attached this challenge with a PCAP file. The PCAP file captures network communication involving the MODBUS protocol, and the challenge is categorized as "very easy" Typically, challenges of this nature involve extracting a flag that needs to be obtained and submitted. Let's kick off our journey.
The first step it will be enumerate the network traffic that we have:
if we open the file in Wireshark Wireshark · Go Deep which is a free and open-source packet analyzer.
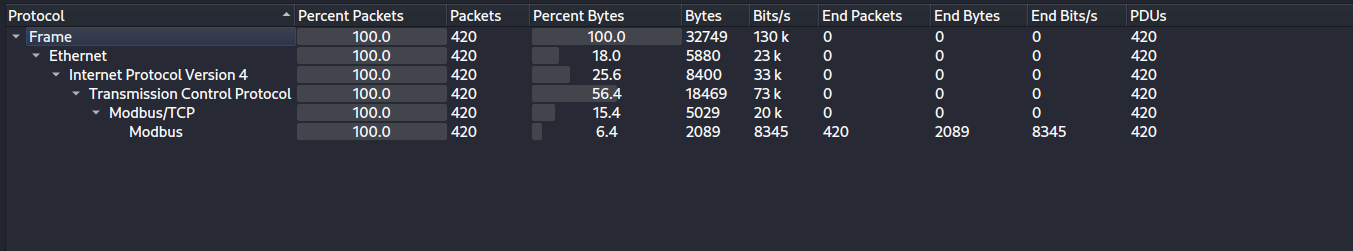
1- let’s check what is the network protocol that is mentioned in this network dump. We can do that by navigate to protocol hierarchy under statistics menu:
as we can see in figure 1, there is Modbus/TCP traffic only.
2- Before we dig in let’s also check how many network nodes involved in this communication:
As we saw before we have only TCP traffic so we can go to TCP tab under endpoints window which is located in statistics menu too.
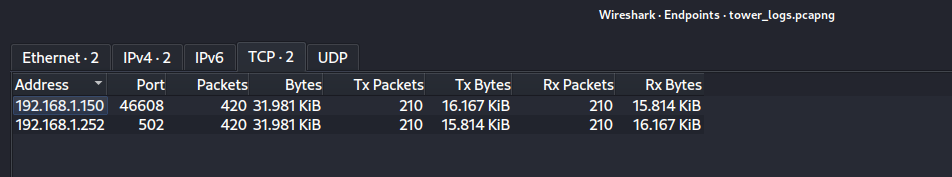
From Figure 2 we can notice that the communication is between two hosts or let’s say two sockets
the first socket is related to TCP port 46608 and 192.168.1.150 IP address, and because 46608 is high dynamic TCP port so we will assume the host 192.168.1.150 is the client.
Same information we can get for the host 192.168.1.252 which has TCP port 502, and this port is reserved to Modbus/TCP and in this case the host presents the server.
Before I dig deeper and as mentioned earlier, the primary objective here isn't just to locate the flag, as that can be achieved quite easily with specific methods—I managed to find it in just five minutes. Instead, the key focus is on gaining a more understanding inside network traffic capture. Let's delve into the details to uncover what's happening beneath the surface of this MODBUS protocol communication and after that I will come back to the challenge.
Modbus
Modbus is a communication protocol used in industrial automation and control systems to enable communication between devices such as programmable logic controllers (PLCs), sensors, and other industrial equipments.
Modbus supports a master-slave architecture, where a master device (such as a supervisory computer or PLC) communicates with one or more slave devices (sensors, actuators, etc.). The protocol defines a set of message formats for exchanging data between the master and slave devices over various communication media, including serial lines (such as RS-232 or RS-485).
Modbus TCP is an extension of the Modbus protocol that allows communication over Ethernet networks. The Master-Slave relation will turn to Server-Client. Unlike the traditional serial communication, which is typically slower and requires specialized hardware, Modbus TCP leverages the widely used Ethernet technology for faster and more flexible communication. It uses the TCP/IP protocol suite for communication, making it compatible with standard Ethernet networks and enabling communication over the internet.
Modbus PDU(Protocol Data Unit): What is the Modbus Protocol & How Does It Work?
The Protocol Data Unit is the smallest data unit that a communication protocol can handle. It represents the data structure or format that is used at a particular layer of the protocol stack (It is the data that each layer adds).
For example in the OSI Model:
- At the application layer, the PDU is often referred to as a "message."
- At the transport layer, it is referred to as a "segment" (TCP) or a "datagram" (UDP).
- At the network layer, it is called a "packet."
- At the data link layer, it is often referred to as a "frame."
- At the physical layer, the PDU is the raw bitstream.
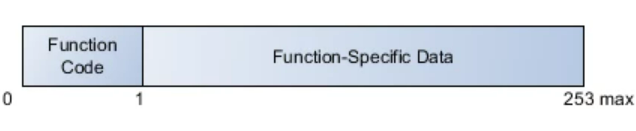
The Modbus PDU format is defined as a function code followed by an associated set of data. The size and contents of this data are defined by the function code, and the entire PDU (function code and data) cannot exceed 253 bytes in size. Every function code has a specific behavior that slaves can flexibly implement based on their desired application behavior.
Before we talk about each function code and how the slave acts with each function code, let’s talk about Modbus supported data (Modbus Data Model)
Modbus-accessible data is stored, in general, in one of four data banks or address ranges: coils, discrete inputs, holding registers, and input registers which are different types of data that can be read from or written to in Modbus-enabled devices such as programmable logic controllers (PLCs) and other industrial equipment.
- Coils:
- Coils represent binary output values, typically used for controlling discrete outputs. Coils can be in either an ON or OFF state. They are often used to control devices such as relays or other binary actuators.
- Discrete Inputs:
- Discrete Inputs represent binary input values. These inputs are read-only and provide information about the state of external devices, such as sensors or switches. Like coils, discrete inputs are addressed numerically and can be in either an ON or OFF state.
- Holding Registers:
- Holding Registers store 16-bit binary data and are used for analog values or configuration settings. Holding registers are read-write, meaning they can be both read from and written to by the Modbus master device. They are often used to store and retrieve data such as setpoints, analog sensor values, or configuration parameters.
- Input Registers:
- Input Registers also store 16-bit binary data, but they are read-only. Input registers are used to provide information about the state of a device or to transmit analog data from sensors to the Modbus master device. Similar to holding registers, input registers are addressed numerically.
Memory Block | Data Type | Master Access | Slave Access |
Coils | Boolean | Read/Write | Read/Write |
Discrete Inputs | Boolean | Read-only | Read/Write |
Holding Registers | Unsigned Word | Read/Write | Read/Write |
Input Registers | Unsigned Word | Read-only | Read/Write |
Table 1. Modbus Data Model Blocks
Data Addressing
The Modbus specification organizes data into blocks, each with an address space of up to 65,536 elements. The address of each data element ranges from 0 to 65,535, but they are numbered from 1 to n, where n has a maximum value of 65,536. For example, coil 1 is at address 0, and holding register 54 is at address 53 within the memory section defined by the slave.
Devices don't have to implement the full range; they can choose specific blocks. For instance, a device might only use holding registers 150 through 175 and 200 through 225. Invalid access attempts are handled through exceptions.
To simplify addressing for documentation and understanding, a numbering scheme was introduced. Instead of saying holding register 14 at address 13, it's referred to as address 4,014, 40,014, or 400,014. The first number (4 in this case) represents the data type (holding registers), and the remaining numbers specify the address. The notation 4XXX, 4XXXX, or 4XXXXX depends on the device's address space usage. If all 65,536 registers are in use, 4XXXXX notation is used, allowing a range from 400,001 to 465,536. If only a few registers are used, a common practice is to use the range 4,001 through 4,999. Each data type is assigned a prefix for clarity, as detailed in Table 2.
Data Block | Prefix |
Coils | 0 |
Discrete Inputs | 1 |
Input Registers | 3 |
Holding Registers | 4 |
Table 2. Data Range Prefixes
Actually for protocol level message, data range prefixes is not important as we will see later because function codes don’t use register map registers (prefixes ). All data addresses start from 0, with the first data item being item number zero. The function code already indicates the register group (0x, 1x, 3x, or 4x reference addresses). For instance, holding register 40001 is addressed as register 0000 in the message's data address field. The function code specifies a "holding register" operation, and the implied reference group is "4xxxx." So, holding register 40108 is addressed as register 006BH (107 in decimal).
Modbus function codes:
The PDU consists of a one-byte function code followed by up to 252 bytes of function-specific data. The function code is the first item to be validated. If the function code is not recognized by the device receiving the request, it responds with an exception. Should the function code be accepted, the slave device begins decomposing the data according to the function definition.
The client request data field provides the slave (server) with any additional information required by the server to complete the action specified by the function code in the client’s request. The data field typically includes register addresses, count values, and written data. For some messages, this field may not exist (has zero length), as not all messages will require data.
table of function codes
Code | Description |
1 | Read Coils |
2 | Read Discrete Inputs |
4 | Read Input Registers |
5 | Write Single Coil |
6 | Write Single Register |
7 | Read Exception Status (serial-only) |
15 | Write Multiple Coils |
16 | Write Multiple Registers |
20 | Read File Record |
21 | Write File Record |
22 | Mask Write Register |
23 | Read/Write Multiple Registers |
24 | Read FIFO |
Table 3: Modbus function codes
Let's see some examples about these function codes, the example was taken from https://www.prosoft-technology.com/kb/assets/intro_modbustcp.pdf
1- Read Coil:
Read Coil Status Query:
Binary data: 0100000004
Filed Name | Example Decimal (Hexadecimal) |
|---|---|
Function Code | 1 (01) |
Starting Address High Order | 0 (00) |
Starting Address Low Order | 0 (00) |
Number Of Points High Order | 0 (00) |
Number Of Points Low Order | 4 (04) |
This example reads the output channel status of coils 0-3:
- The function code, denoted as 1, corresponds to the "read coil" operation, while the subsequent bytes represent the function data.
- The following two bytes, 0000, specify the starting point for reading, indicating the initiation of the reading process from the first coil (coil 0).
- The final two bytes, 0004, specify the length of the reading operation, indicating the intention to read data from four consecutive addresses starting from the initial point.
Note that the leading character of the 0x reference address is implied by the function code and omitted from the address specified. In this example, the first address is 00001, referenced via 0000 in the request, and corresponding to coil 0.
Read Coil Status Response:
Binary data: 01010A
Filed Name | Example Decimal (Hexadecimal) |
|---|---|
Function Code | 1 (01) |
Byte Count | 1 (01) |
Data (Coils 3-0) | 10 (0A) |
Note that the response function code is the same as the request function code (which indicate that the operation was completed successfully) and the number of bytes is one.
To summarize, the status of coils 3-0 is shown as the byte value 0A hex, or 00001010 binary. Coil 3 is the fifth bit from the left of this byte, and coil 0 is the LSB. The four remaining bits (toward the high-order end) are zero. Reading left to right, the output status of coils 3..0 is ON-OFF-ON-OFF.
Bin | 0 | 0 | 0 | 0 | 1 | 0 | 1 | 0 |
|---|---|---|---|---|---|---|---|---|
Coil | NA | NA | NA | NA | coil3 | coil2 | coil1 | coil0 |
2-Write Multiple Registers (16):
Write Multiple Registers Query:
Binary data: 10000000030600C800050002
Filed Name | Example Decimal (Hexadecimal) |
|---|---|
Function Code | 16 (10) |
Starting Register High Order | 0 (00) |
Starting Register Low Order | 0 (00) |
Number Of Registers High Order | 0 (00) |
Number Of Registers Low Order | 3 (03) |
Byte count | 6 (06) |
Data to be written High (First Register) | 0 (00) |
Data to be written Low (First Register) | 200 (C8) |
Data to be written High (Second Register) | 0 (00) |
Data to be written Low (Second Register) | 5 (05) |
Data to be written High (Third Register) | 0 (00) |
Data to be written Low (Third Register) | 2 (02) |
This example writes a new data to server holding registers 40001 through 40003:
- The function code, denoted as 16, corresponds to the "Write Multiple Registers" operation, while the subsequent bytes represent the function data.
- The following two bytes, 0000, specify the starting point for writing, indicating the initiation of the writing process from the first register(register 40001).
- The following two bytes, 0003, specify the length of the writing operation, indicating the intention to write data into three consecutive addresses starting from the initial point.
- The following one byte, 06 specify number of bytes that should be written
- The following 6 bytes specify the data that should be written in the registers 40001, 40002 , 40003 which are 0x00C8, 0x0005 and 0x0002 respectively.
Note that the leading character of the 4x reference address is implied by the function code and omitted from the address specified (the addresses don’t start with 4x). In this example, the first address is 40001, referenced via 0000 in the request, and corresponding to holding register 0.
Write Multiple Registers Response:
Binary data: 1000000003
Filed Name | Example Decimal (Hexadecimal) |
|---|---|
Function Code | 16 (10) |
Starting Register High Order | 0 (00) |
Starting Register Low Order | 0 (00) |
Number Of Registers High Order | 0 (00) |
Number Of Registers Low Order | 3 (03) |
The response function code , starting register reference, and number of registers to write, after the register contents have been written, are the same as the request. Note that it does not echo the written values.
Before we finish I want to talk about two important things, exceptions and Modbus Application Protocol Header
Exceptions:
Slaves use exceptions to indicate a number of bad conditions, from a malformed request to incorrect inputs. However, exceptions can also be generated as an application-level response to an invalid request. Slaves do not respond to requests issued with an exception. Instead, the slave ignores incomplete or corrupted requests and begins waiting for a new incoming message.
Exceptions are reported in a defined packet format. First, a function code is returned to the requesting master equal to the original function code, except with its most significant bit set. This is equivalent to adding 0x80 to the value of the original function code. In lieu of the normal data associated with a given function response, exception responses include a single exception code.
Within the standard, the four most common exception codes are 01, 02, 03, and 04. These are shown in Table 4 with standard meanings by each function.
01 | The received function code is not supported. To confirm the original function code, subtract 0x80 from the returned value. |
02 | The request attempted to access an invalid address. In the standard, this can happen only if the starting address and the requested number of values exceeds 216. However, some devices may restrict this address space in their data model. |
03 | The request had incorrect data. In some cases, this means that there was a parameter mismatch, for example between the number of registers sent and the “byte count” field. More commonly, the master requested more data than either the slave or protocol allows. For example, a master may read only 125 holding registers at a time, and resource-limited devices may restrict this value to even fewer registers. |
04 | An unrecoverable error occurred while attempting to process the request. This is a catchall exception code that indicates the request was valid, but the slave could not execute it. |
Modbus Application Protocol Header(MBAP):
Each Modbus message contains PDU (function code + data) and Header, the whole message with PDU and Header called ADU (Application Data Unit) as shown if figure 4
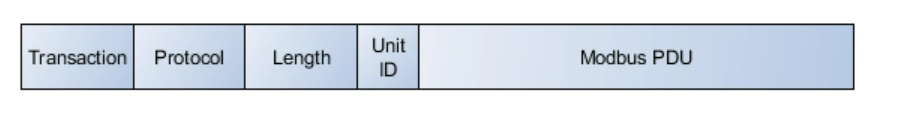
- Transaction Identifier (Transaction ID):
- Size: 2 bytes
- Purpose: Uniquely identifies a transaction between a Modbus master and a Modbus slave. The same identifier is used in both the request and response messages to correlate them.
- Protocol Identifier (Protocol ID):
- Size: 2 bytes
- Purpose: Identifies the Modbus protocol in use. For Modbus TCP, this field is typically set to 0 for Modbus Protocol.
- Length Field:
- Size: 2 bytes
- Purpose: Specifies the number of remaining bytes in the message, including the Unit Identifier, PDU (Protocol Data Unit), and additional fields.
- Unit Identifier (Unit ID):
- Size: 1 byte
- Purpose: Identifies the slave device that should respond to the Modbus message. In Modbus TCP, this is typically set to 0 since the slave's address is determined by the IP address.
Now that we have covered all the essential details about Modbus, let's come back to our challenge
Watch Tower (Again)
As mentioned earlier, the entirety of the traffic pertains to Modbus/TCP. Now, let's examine the Modbus Function Codes present in this traffic. For this task, I will use tshark, a terminal-oriented variant of Wireshark. The key advantage of using tshark in this context is its ability to filter and retrieve the specific information we need from the traffic (display filters).
tshark -r tower_logs.pcapng -T fields -e modbus.func_code | sort -u -g
-r tower_logs.pcapng: Specifies the input file (packet capture file) named for analysis.-T fields: Specifies the output format as fields, which means the command will extract specific fields from the packets.-e modbus.func_code: Specifies the field to extract, which, in this case, is the Modbus Function Code. This field represents the function code of the Modbus request or response. you can check display filters for Modbus Wireshark · Display Filter Reference: Modbussort -u -g: Sorts (-g numeric sort) the extracted Modbus Function Codes in ascending order and then removes duplicate entries (-u).
In the output of this command we will see three functions code, 1, 15, 16. From table 3 we can notice that codes are related to Read coils, Write Multiple Coils and Write Multiple Registers respectively.
Now let’s check the order of these function codes in our traffic, to get more information about behavior:
tshark -r tower_logs.pcapng -T fields -e modbus.func_code | uniq -c
we use the same tshark command above but we pip the output to uniq command to show the count of occurrences for each line.
and the output is:
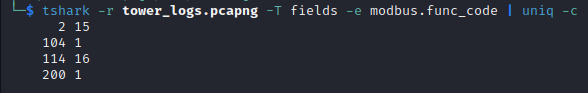
In Figure 5, the initial two packets correspond to Function Code 15 (Write Multiple Coils), with one packet serving as a query and the other as a response. This pattern continues throughout the entire output.
In summary, the sequence of operations unfolds as follows: initially, we write multiple coils using a single query (function code 15). Subsequently, a read operations for multiple coils takes place (function code 1). Following this, there is a write operations for multiple registers (function code 16), and finally, another read operations for multiple coils.
Now let's examine the correlation between time and TCP sequence numbers. This analysis aims to provide insights into the duration and the characteristics of the traffic.
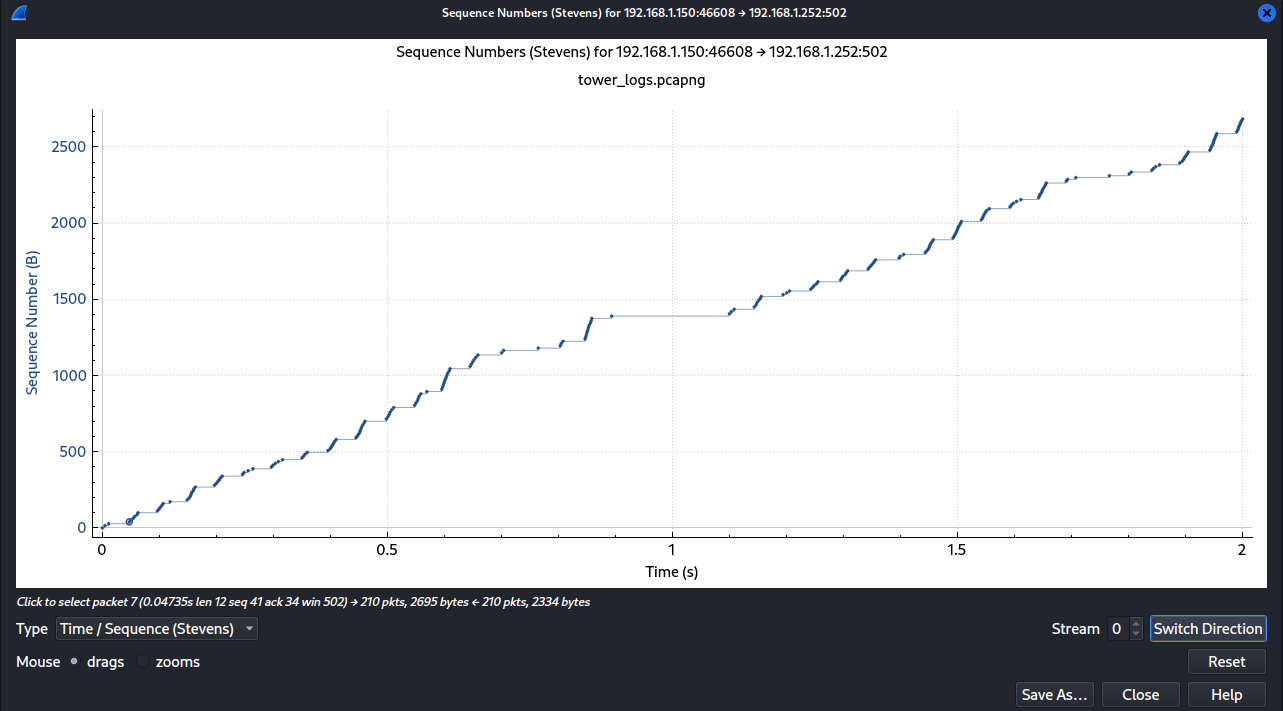
We observe from figure 6 that the duration of the generated traffic spans 2 seconds, and there is a singular TCP stream. Notably, the source (client) consistently generates data at nearly the same frequency throughout this period.
At this point let’s examine each packets that are related to each function code
1- Write Multiple Coils(15):
let’s start by examining the two packets that is related to Write Multiple Coils, to do that let’s filter these two packets using Wireshark filter modbus.func_code == 15, as shown in figure 7

Now let’s see how Wireshark parse the Read Coils query and response.
Write Multiple Coils query (figure 8):
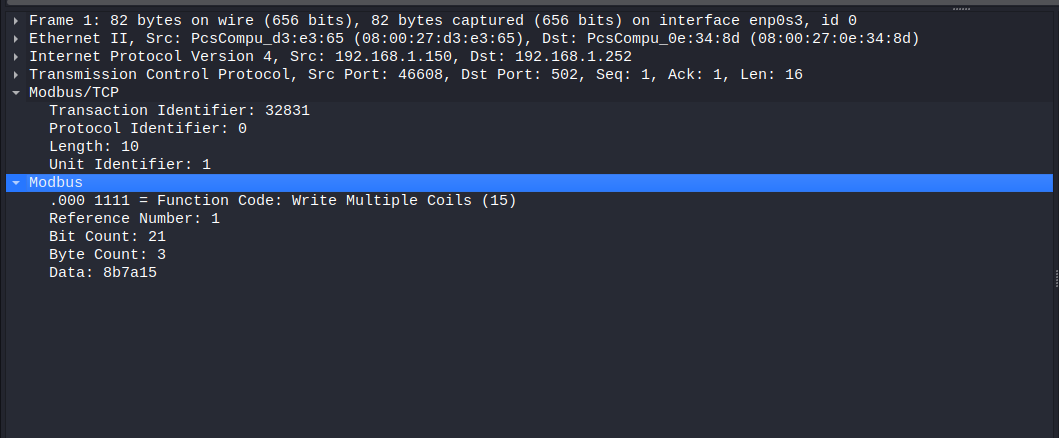
I will focus on PDU only. We didn’t review the Write Multiple Coils function code before, but it is almost like Write Multiple Registers (15) function code.
- function code is 15
- Starting address (Reference Number in Wireshark) is coil 1 which is the second coil (remember coil 0 is the first)
- Number Of Points (Bit count in Wireshark) are 21 which are from coil 1 to coil 21
- Byte Count is three
- Data which is the data that should be written from coil 1 to coil 21
Write Multiple Coils response (figure 8):
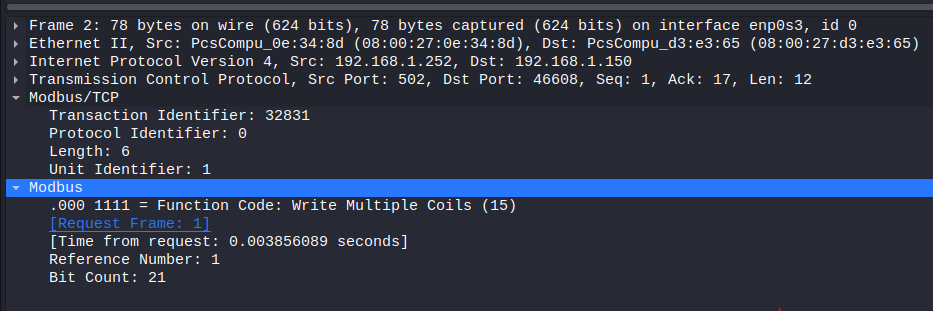
- function code is 15
- Starting address (Reference Number in Wireshark) is coil 1 which is the second coil
- Number Of Points (Bit count in Wireshark) are 21 which are from coil 1 to coil 21
This response indicates the successful completion of the write operation.
As we conclude this phase, let's construct a table to examine the status of coils ranging from 1 to 21.
The first eight coils (coil1 to coil8), corresponding to the first byte which is
0x8b = 10001011
coil1 | coil2 | coil3 | coil4 | coil5 | coil6 | coil7 | coil8 |
|---|---|---|---|---|---|---|---|
1 | 1 | 0 | 1 | 0 | 0 | 0 | 1 |
the second eight coils (from coil 9 to coil 16), corresponding to the second byte which is
0x7a = 01111010
coil9 | coil10 | coil11 | coil12 | coil13 | coil14 | coil15 | coil16 |
|---|---|---|---|---|---|---|---|
0 | 1 | 0 | 1 | 1 | 1 | 1 | 0 |
Because we only wrote 21 coils, the coils from 17 to 21 will specifically be impacted. The third byte corresponding to these coil is 0x15 = 00010101
coil17 | coil18 | coil19 | coil20 | coil21 | coil22 | coil23 | coil24 |
|---|---|---|---|---|---|---|---|
1 | 0 | 1 | 0 | 1 | NA | NA | NA |
2- Read Coils (1):
Next we will examine the Read Coil packets. If we filtered for Read Coils function code in Wireshark using modbus.func_code == 1 we can see that there are 304 packets with this function code so we have 152 read coil query. Now let’s see how Wireshark parse the Read Coils query and response.
Let’s get packets number 5 and 6 which are Read Coils query and Read Coils response respectively.
Read Coil query (figure 9):
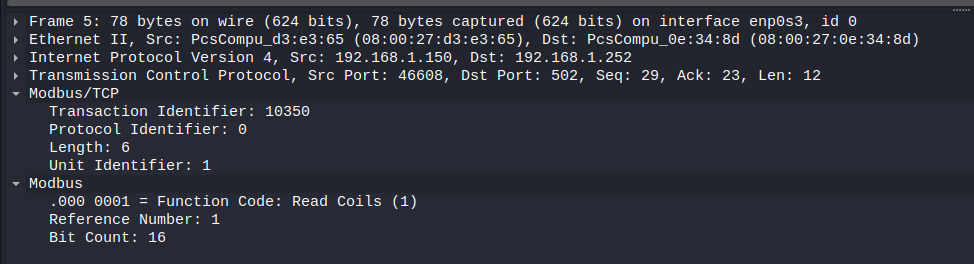
if we compare the fields under Modbus in Wireshark with our previous Read coil query example, we can see that
- function code is 1 which is under the same name in Wireshark
- Starting address (Reference Number in Wireshark) is coil 1 which is the second coil
- Number Of Points (Bit count in Wireshark) are 16 which are from coil 1 to coil 16
Read Coil response (figure 10):
Let’s parse the response now:
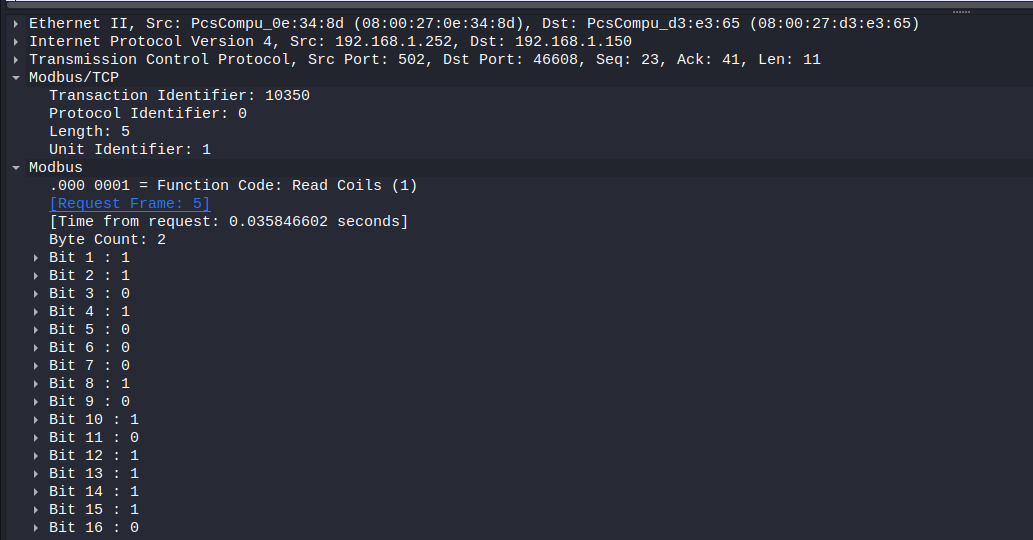
Let’s do the same comparing:
- Function code is 1 which is under the same name in Wireshark
- Byte Count which is 2 bytes is under the same name in Wireshark
- Data, we can see it in Wireshark under Bit 1 to Bit 16
Now let’s get start analyzing the whole traffic that related to read coil.
our purpose here to check the value of each coil and the changed that happened to it during time.
Let’s get the factors of our analysis:
1- Reference number (starting address):
This number will serve as a reference for determining the coil to be read. Let's examine the additional reference numbers:
tshark -r tower_logs.pcapng -Y "modbus.func_code == 1" -T fields -e modbus.reference_num | sort -u
To obtain all the reference numbers, we utilized tshark with a display filter of modbus.reference_num specifically for Read Coil packets. The subsequent step involved piping the results to ensure a sorted list of unique reference numbers.

From Figure 11 we can see, there is only (1) as reference number. Therefore, all queries are reading from the second coil (coil number 1).
2- Bit Counts:
As we saw before Bit Counts indicates how many coils we want to read.
let’s do the same and check all the bit counts
tshark -r tower_logs.pcapng -Y "modbus.func_code == 1 and tcp.dstport == 502" -T fields -e modbus.bit_cnt | sort -u -g
By adding the filter tcp.dstport == 502, we specifically focus on packets where the TCP destination port is 502. This condition ensures that we isolate queries (Bit Counts exists in quires only), as queries typically travel from the Modbus client (using a dynamic port) to the Modbus server (using the well-known port 502).
the output for this command in figure 12:

The output indicates that there are queries within the captured data that read coils spanning from 1 to 20 bits, commencing from coil number 1.
In conclusion, we can retrieve the values for coils starting from the second coil up to the 21st coil. It's worth noting that while in some scenarios the values of these coils might change over time due to automation processes or client-initiated modifications, in our specific analysis, we've established that the client doesn't alter coil values during this stage. Therefore, any observed changes in the values would likely be attributed to internal processes, which, as mentioned earlier, are not a factor in this particular straightforward traffic dump.
So let’s get the packets that read coils from 1 to 20 by using modbus.bit_cnt == 20

From Figure 12, we can observe that the read requests occur at different times. Now, let's compare the responses for each packet. Although we anticipate that the responses will be consistent, it is good practice to validate this expectation for future scenarios.
In each Modbus packet there is Modbus header and inside it there is transaction identifier
which should be identical between response and request.
First let’s use tshark to get all transaction identifier for these 5 packets
tshark -r tower_logs.pcapng -Y "modbus.bit_cnt == 20" -T fields -e mbtcp.trans_id | tee trans_ids
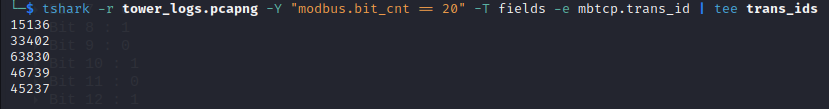
I have filtered the packets with a bit count equal to 20. Afterward, I extracted the transaction identifiers and saved the resulting output to a file named "trans_ids."
Now lets get the bit values (coils values) for each transaction id listed in the file using a bash for loop
for i in cat trans_ids; do tshark -r tower_logs.pcapng -Y "mbtcp.trans_id == $i and tcp.srcport == 502" -T fields -e modbus.bitval; done
Let's begin with the tshark command. I utilized the filter mbtcp.trans_id to precisely obtain the transaction identifiers. Additionally, I specified that the TCP source port should be 502, indicating Modbus server responses exclusively. By using the trans_id filter alone, we obtain both the query and response packets associated with this transaction identifier. For each response packet, the corresponding bit values are listed.
Finally, a simple for loop is employed to iterate through all the transaction identifiers stored in our file

From figure 14, we observe that the bit values for all the packets remain consistent. At this stage, it is evident that there is no alteration in coil values during the reading process. If we encounter a line with values like "1,1,0,1,0,0,0,1,0,1,0,1,1,1,1,0,1,0,1,0," these values correspond to coil 1 being equal to 1 and coil 20 being equal to 0 (from left to right).
Upon comparing these values with the ones from the previous stage (when coil values were written), they are found to be identical.
In conclusion, during the initial phase, we wrote coil values from coil 1 to coil 21, and subsequently, we read these values multiple times using various bit counts. Returning to our challenge, at this point, there is no noteworthy information related to flags. We solely have the bytes 8b7a15 that were written and read, and there is no ASCII-related content of interest.
3- Write Multiple Registers (16):
we are left with only one remaining function code, which is Write Multiple Registers. This function code involves the writing of data to multiple holding registers let’s check it in Wireshark (figure 15) and do some initial analysis
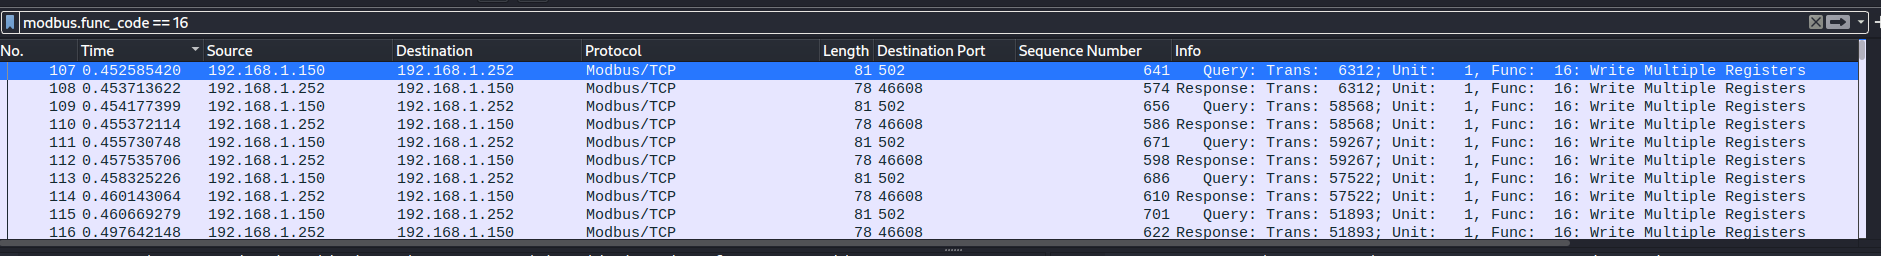
we have 114 packets under this function code, so we have 57 write registers packets quries . As we did before let’s examine write query and write response
Write Multiple Registers query (figure 16):
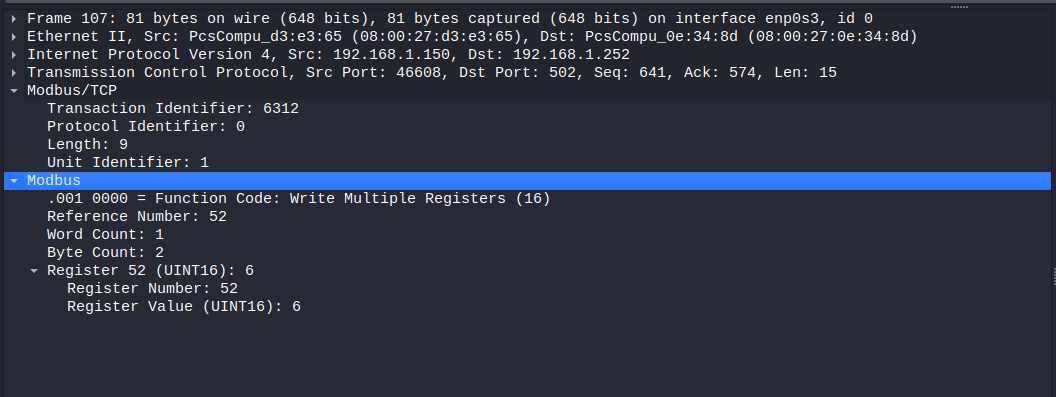
if we compare the fields under Modbus in Wireshark with our previous Write Multiple Registers query example, we can see that:
- function code is 16 which is under the same name in Wireshark
- Starting register (Reference Number in Wireshark) is register 52
- Number Of Registers (Word count in Wireshark) is 1 so we wrote register 52 only
- Data to be written (Register Value in Wireshark) is 6 as (UINT16)
Write Multiple Registers response (figure 17):
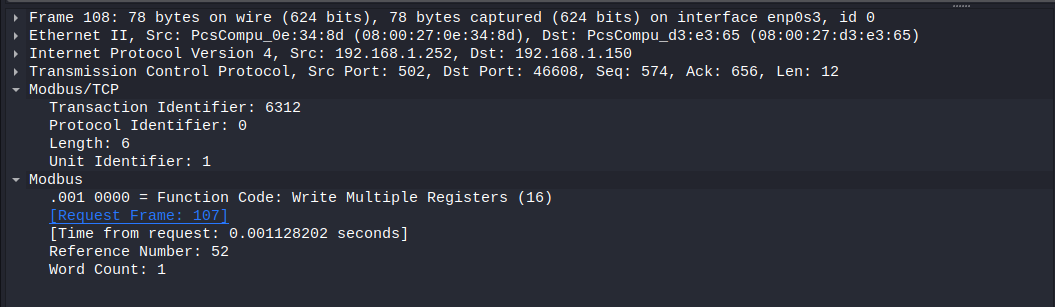
- function code is 16 which is under the same name in Wireshark
- Starting register (Reference Number in Wireshark) is register 52
- Number Of Registers (Word count in Wireshark) are 1
This indicate that we wrote the register successfully
Now let’s check our analysis factors:
1- Word Count:
let’s check first how many registers we wrote in each write query we have:
tshark -r tower_logs.pcapng -Y "modbus.func_code == 16 and tcp.dstport == 502" -T fields -e modbus.word_cnt | sort -u
we filtered requests that are related to function code 16 and we piped the output to sort -u to delete duplicated lines

we can see from figure 18, that we wrote one register only in each query
2- Reference Number:
Let’s check how many register we wrote
tshark -r tower_logs.pcapng -Y "modbus.func_code == 16 and tcp.dstport == 502" -T fields -e modbus.reference_num |sort -u | wc -l
we filtered requests that are related to function code 16 and we piped the output to sort -u to get unique write quires and after that we piped it to wc tool to check how many write registers query we have (we just count how many lines)

we wrote 36 unique registers, now let’s check what are these registers and how many times we wrote each one
tshark -r tower_logs.pcapng -Y "modbus.func_code == 16 and tcp.dstport == 502" -T fields -e modbus.reference_num | sort -g | uniq -c
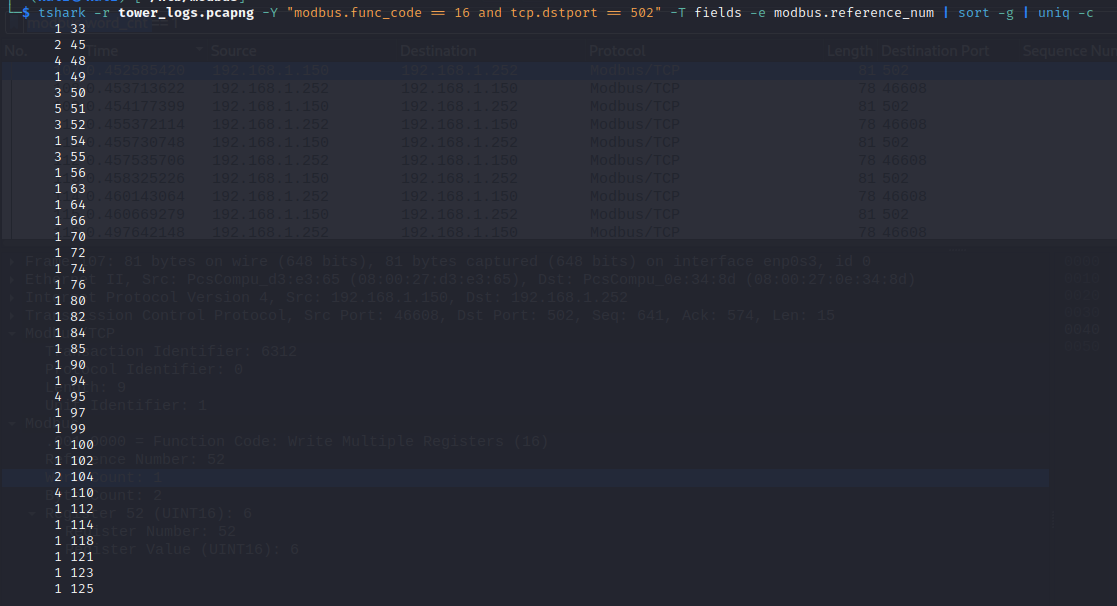
In Figure 20, the first column represents the number of times the register was written, while the second column denotes the reference number of the register.
3- Written data:
let’s check what data we wrote in each register
tshark -r tower_logs.pcapng -Y "modbus.func_code == 16 and tcp.dstport == 502" -T fields -e modbus.reference_num -e modbus.regval_uint16 > data
modbus.regval_uint16 will give us the data that related to each register
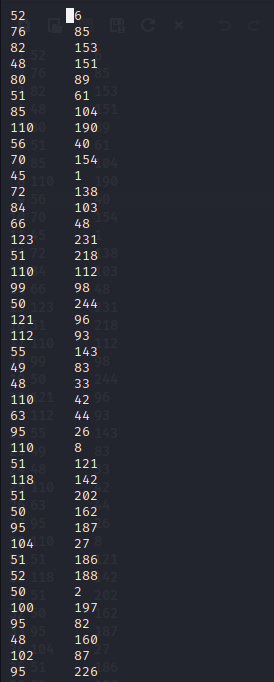
I won't include all the output in the photo, but in the figure 20 above, the first column indicates the register reference numbers, while the second column displays the associated data. Please note that the is presented in decimal format.
At this point we analyzed all the traffic in a deep way and we got all data that is related to coils and registers.
The final aspect to address is the flag. At this stage, specifically during the "write multiple coils" operation, we observe data with high entropy. It is highly probable that by decoding this data using ASCII, we can get the flag. To achieve this, let's utilize the awk tool.
awk '{printf "%c,%c\n", $1, $2}' data
'{printf "%c %c\n", $1, $2}': The single-quoted portion is the Awk script. It specifies aprintfstatement that prints the first and second fields of each input record ($1and$2) separated by a comma and followed by a newline. The%cformat specifier inprintfis used to print a character.data: This is the input file for Awk. which is the regester number and the data realted to id
from the output below we can see in line 12, 13 ,14,15 we have HTB{ which is the beginning of the flag
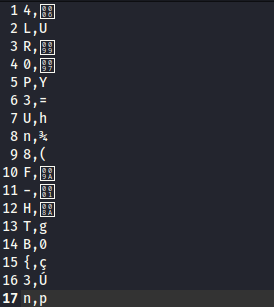
So the flag is located in the ascii representation of the register reference numbers, if you want easy submit use awk as:
awk '{printf "%c", $1}' file
and you will get the flag in one line
